Traffic
We measure total available bandwidth and current capacity by aggregating what relays and bridges report to directory authorities.
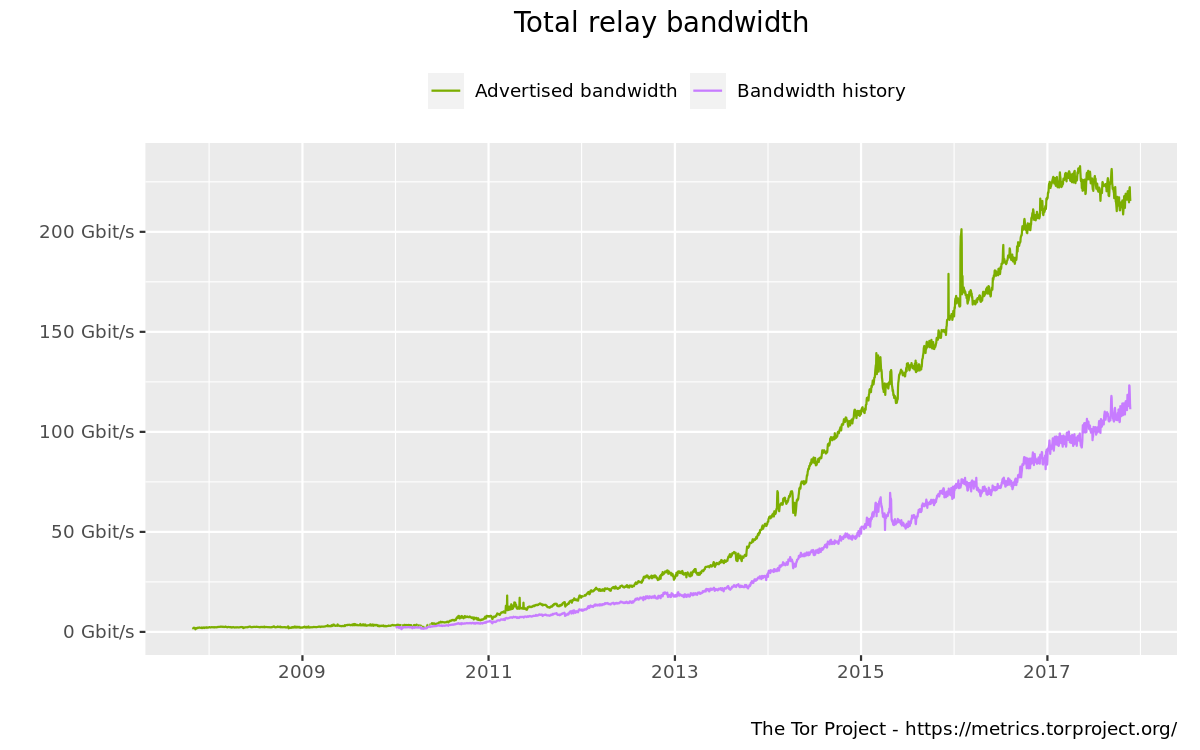
This graph shows the total advertised and consumed bandwidth of all relays in the network.

We measure total available bandwidth and current capacity by aggregating what relays and bridges report to directory authorities.
This graph shows the total advertised and consumed bandwidth of all relays in the network.
© 2009–2023 The Tor Project
This material is supported in part by the National Science Foundation under Grant No. CNS-0959138. Any opinions, finding, and conclusions or recommendations expressed in this material are those of the author(s) and do not necessarily reflect the views of the National Science Foundation. "Tor" and the "Onion Logo" are registered trademarks of The Tor Project, Inc.. Data on this site is freely available under a CC0 no copyright declaration: To the extent possible under law, the Tor Project has waived all copyright and related or neighboring rights in the data. Graphs are licensed under a Creative Commons Attribution 3.0 United States License.